Monitor Experiments
- In the gateway after launching an experiment, you can
Monitor Experiments
- Individual experiment status can be monitored from 'Experiment Summary Page'.
- User can also view all the experiment s statuses from 'Experiment Browse' page as well and further monitory a selected specific one.
- Based on your permission level you would have access to information.
- Generally as soon as you create your login and access this page, you would see grayed out "Applications" (See Image: Portal Workspace)
- Applications are your tools or codes that you would select to launch jobs ar remote resources. TIP: Mark your "Favorites" using the star on the tile.
- On your right, you would see your latest computational experiments and their statuses.
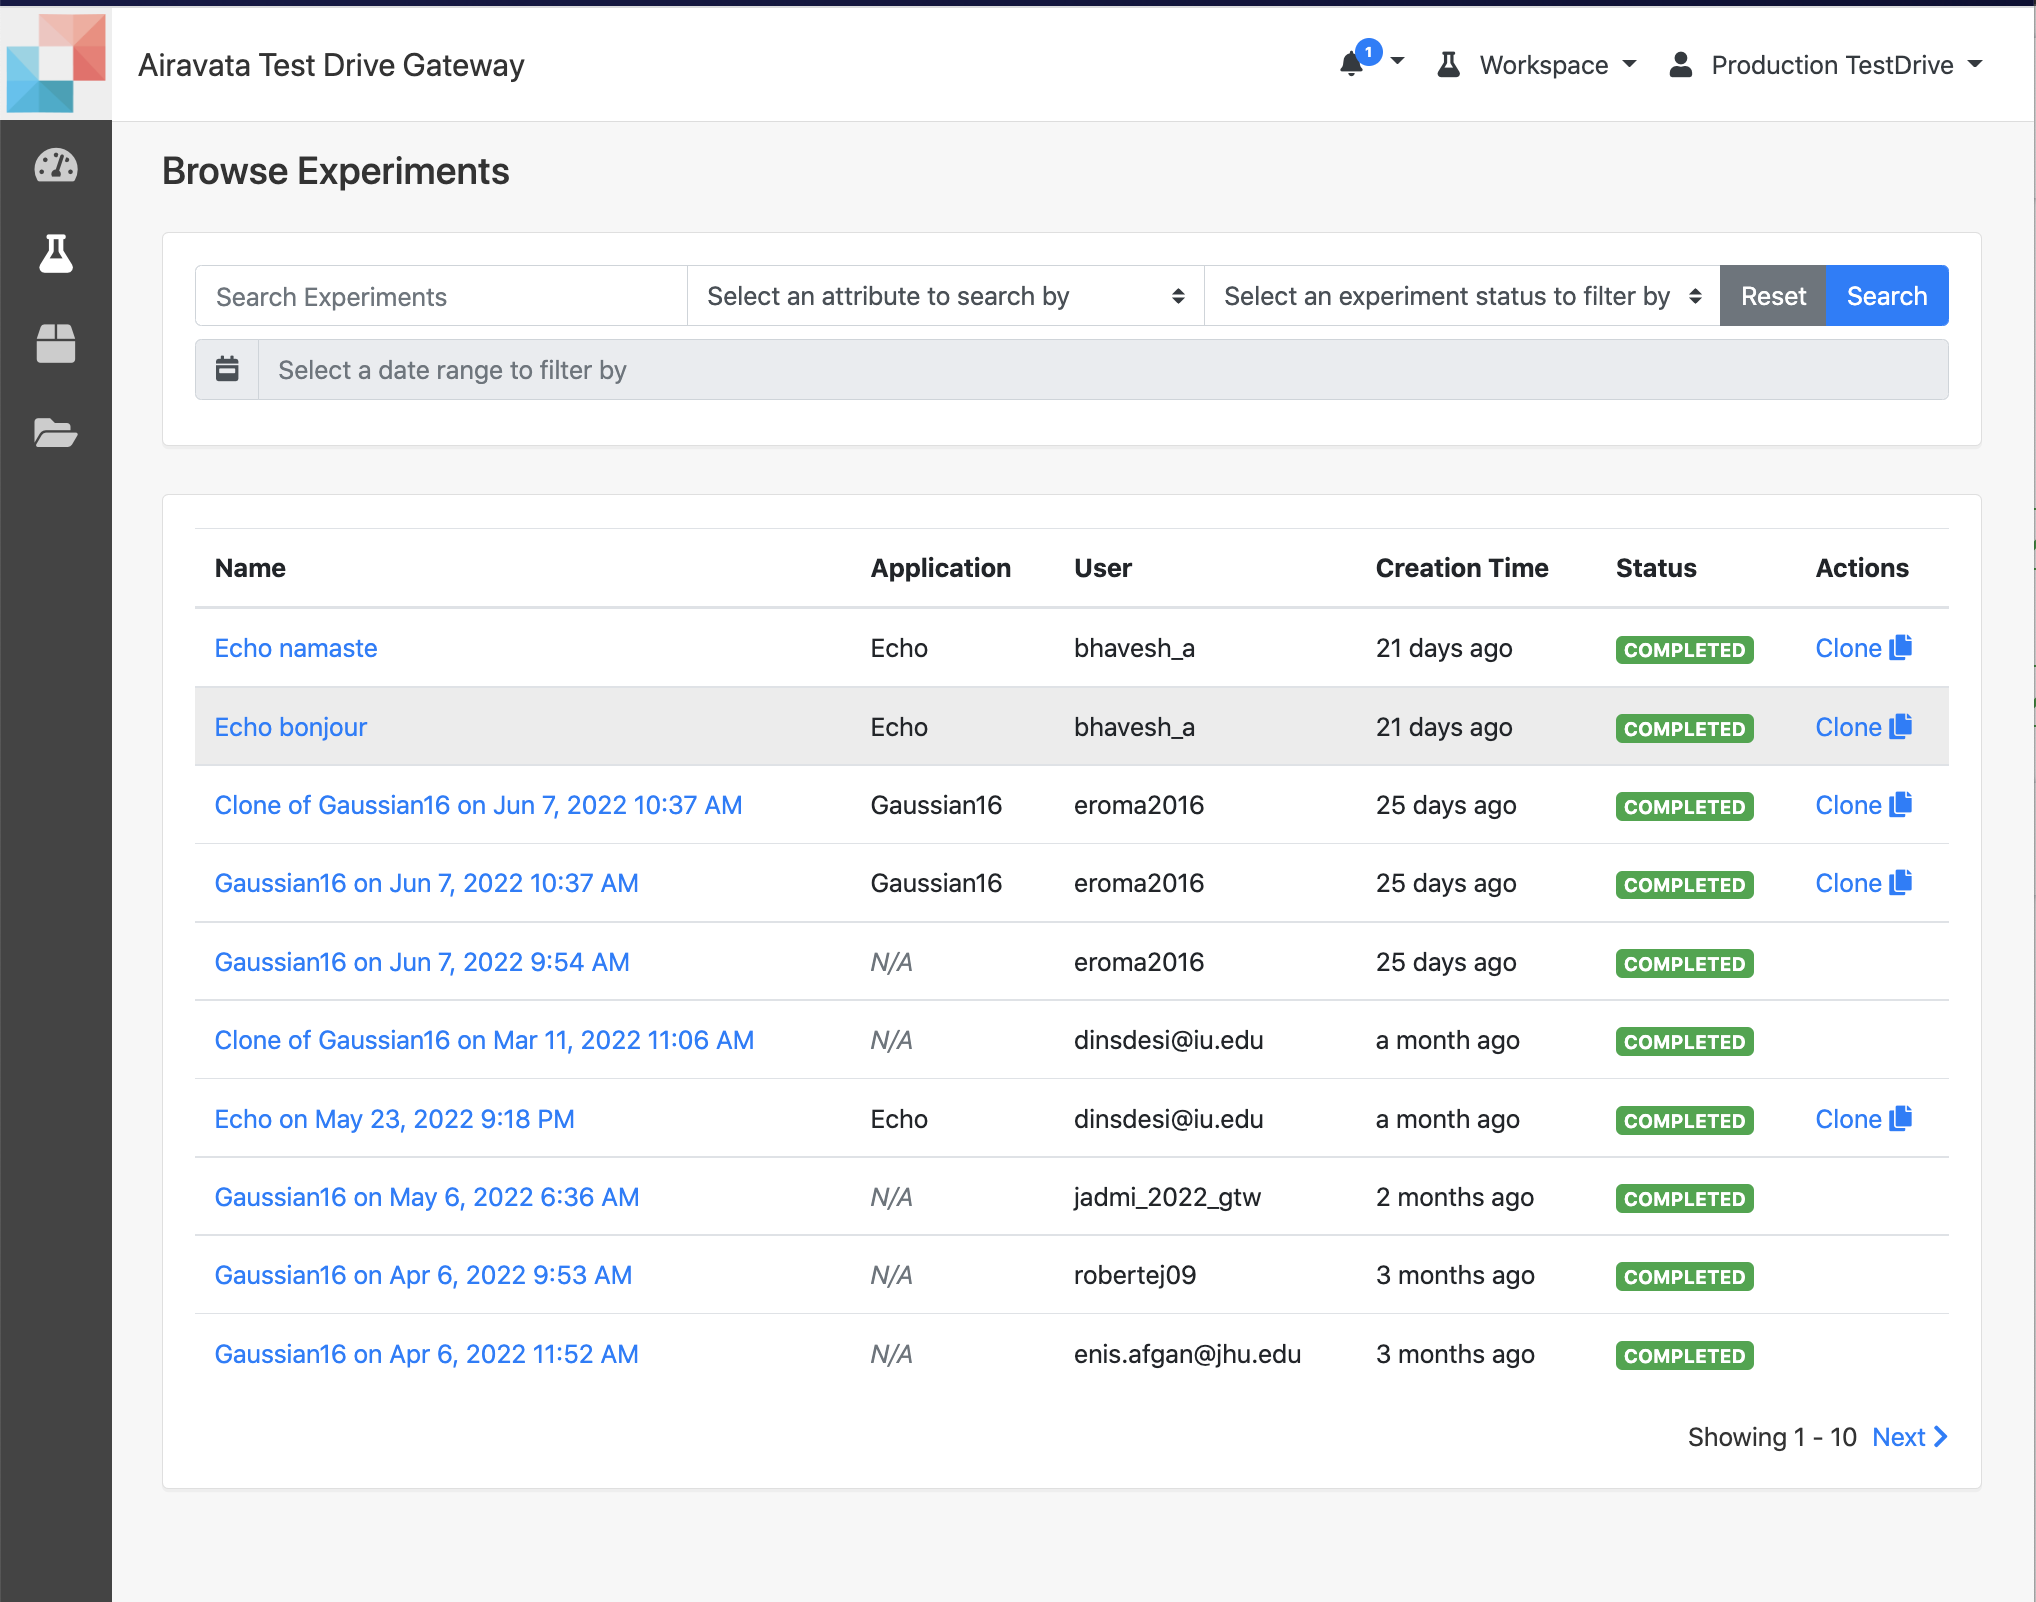 Image: Browse Experiments
Monitor Jobs
- The 'Experiment' is what you create using an existing Application in the workspace to launch a job in an external computational resource.
- Select an application from the workspace and you would then be able to create an experiment providing the inputs and computational resource queue properties.
- After providing the required inputs and creating the experiment either "Save & Launch" or "Save" to launch later.
- An experiment may have one-to-one or one-to-many relationship with computation jobs launched at remote resources.
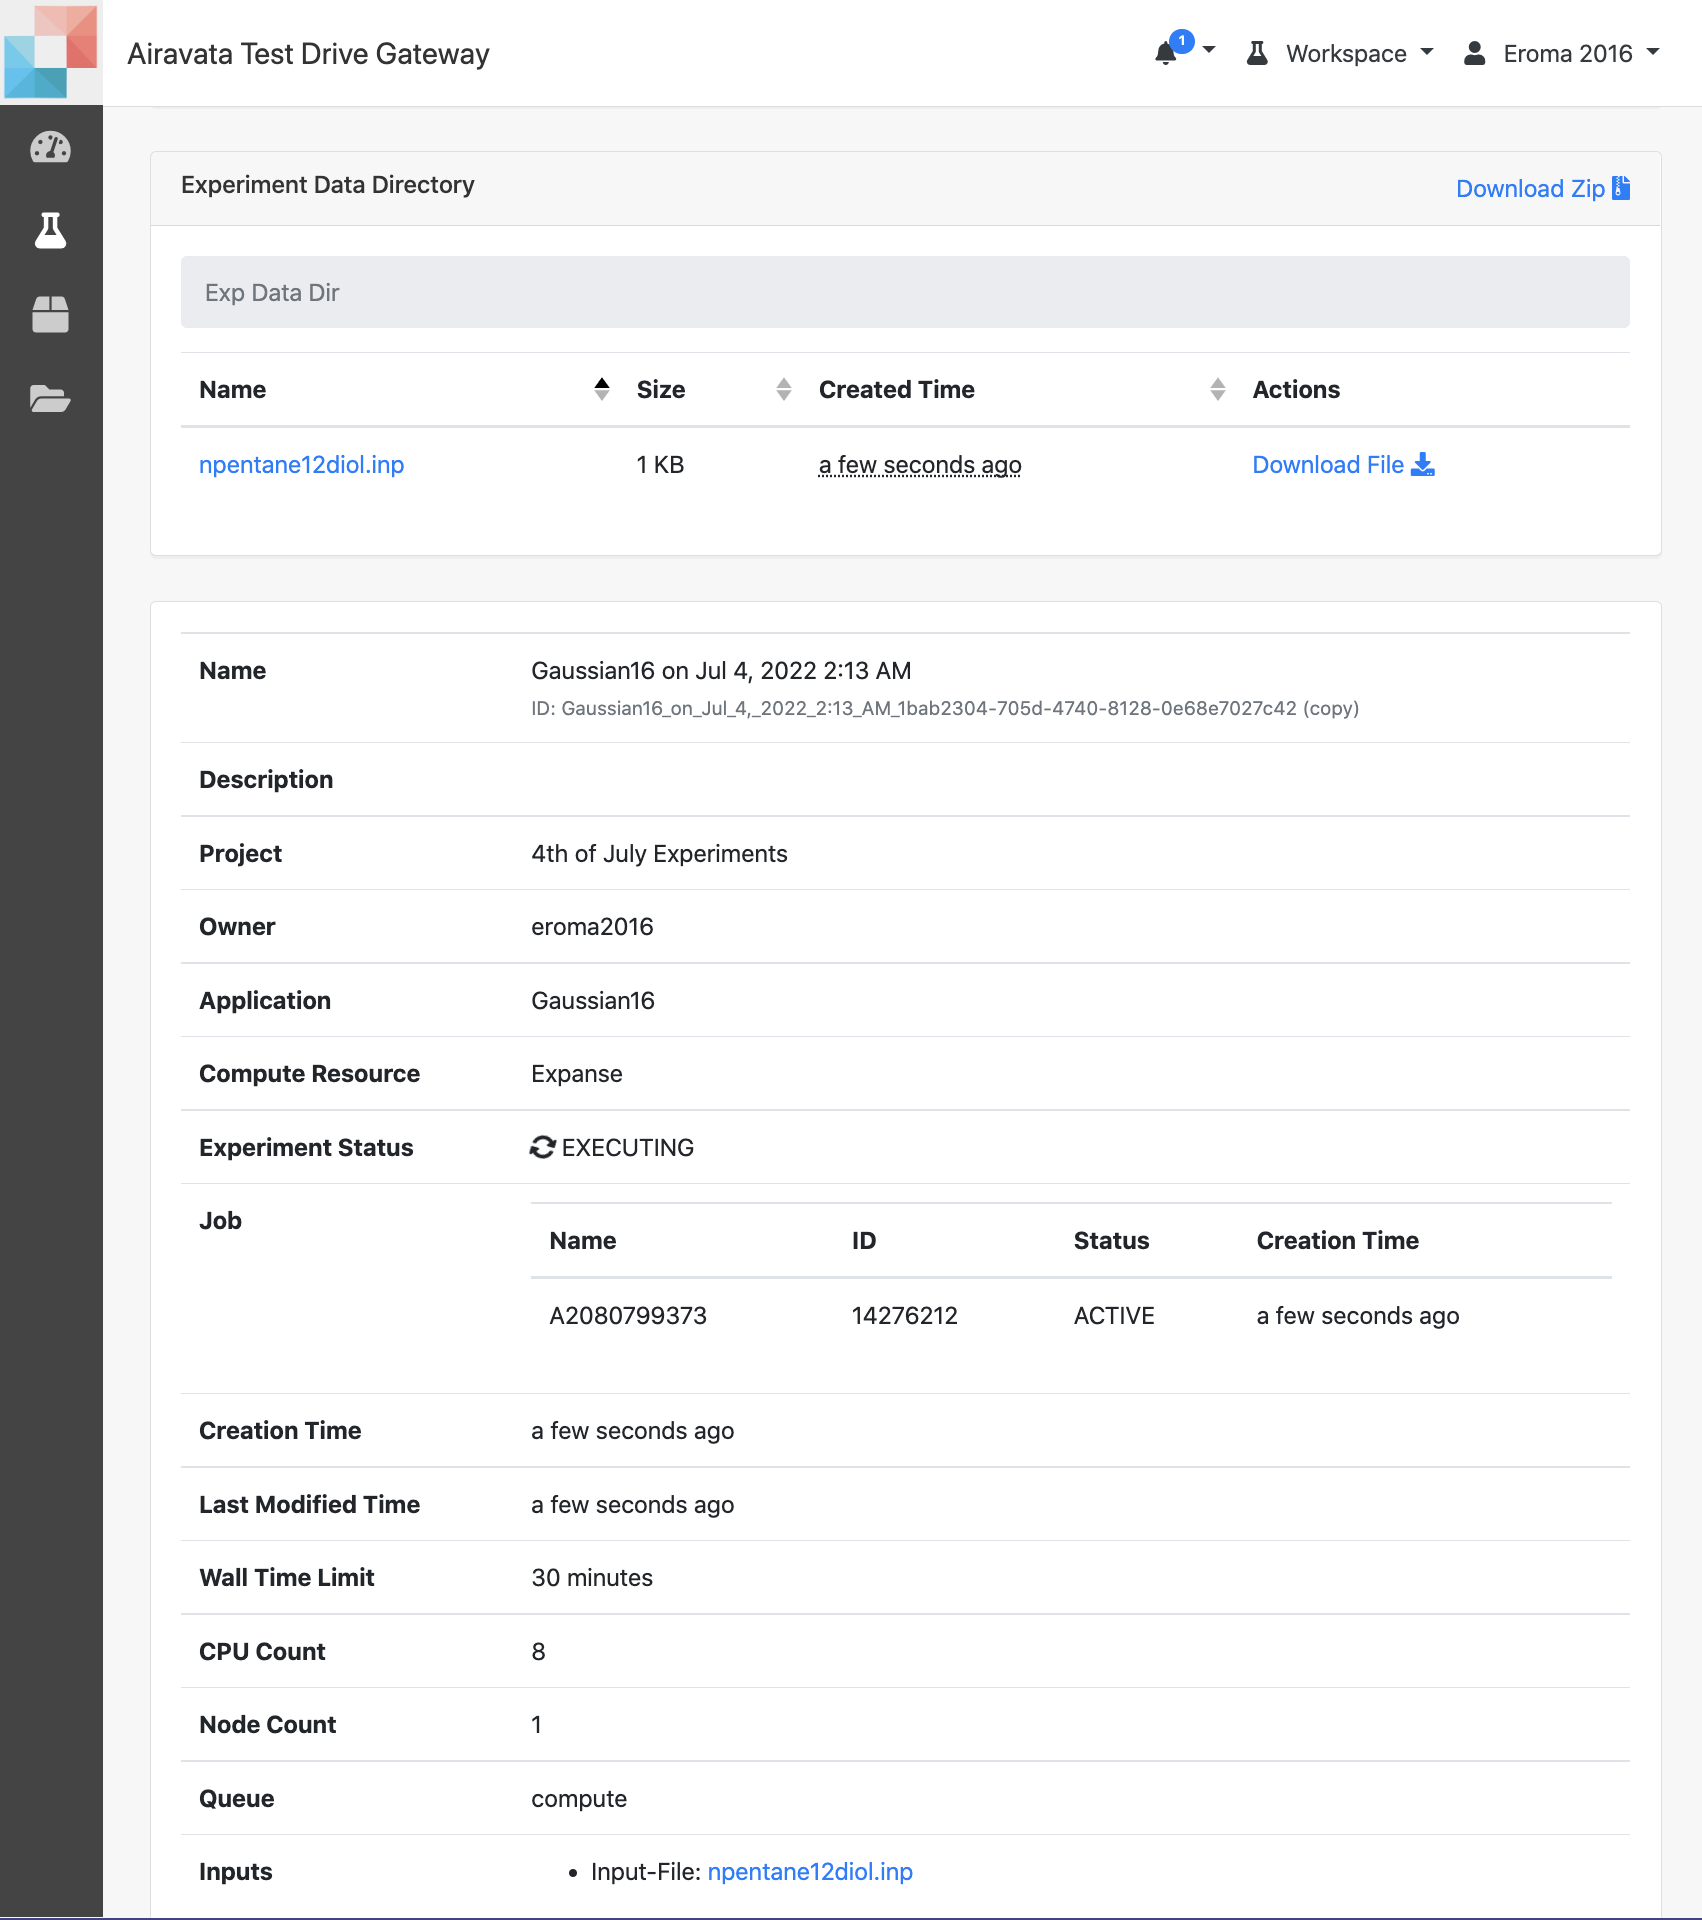 Image: Experiment Summary with Active Job
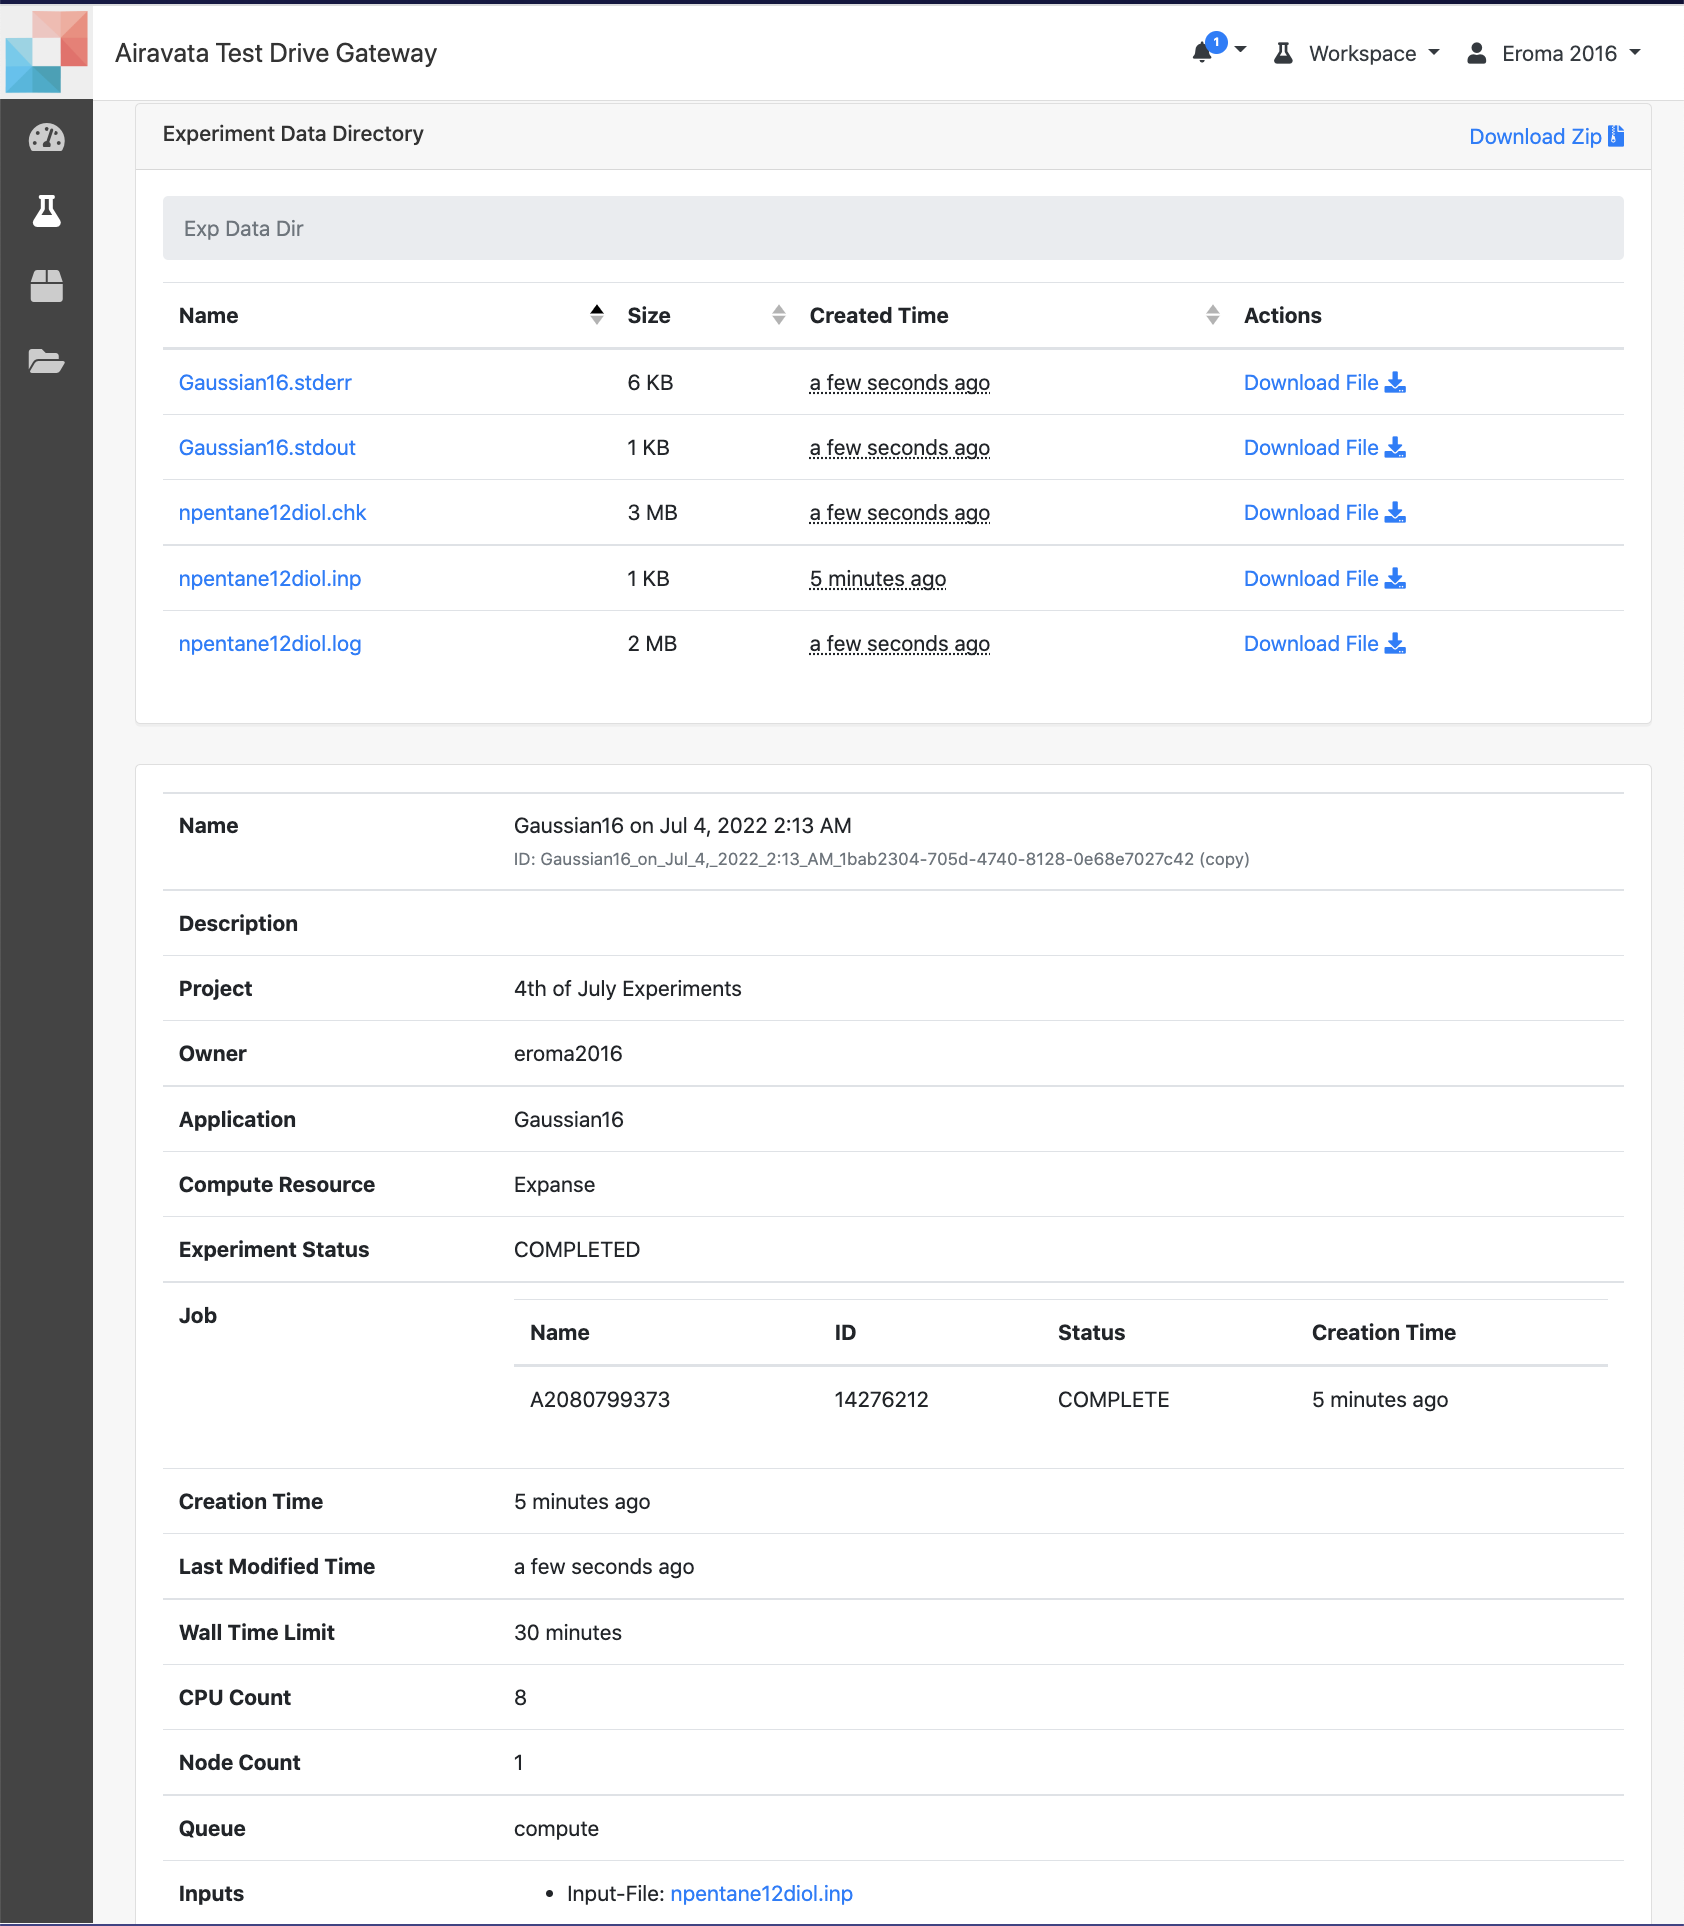 Image: Experiment Summary with Completed Job & Outputs
Fetch Intermediate Files
-
Once the job is submitted to remote resource and active, users have the option os fetching configured output files for the application.
-
For each file, there is a button to fetch them and user can view the files to decide to keep the job or to cancel.
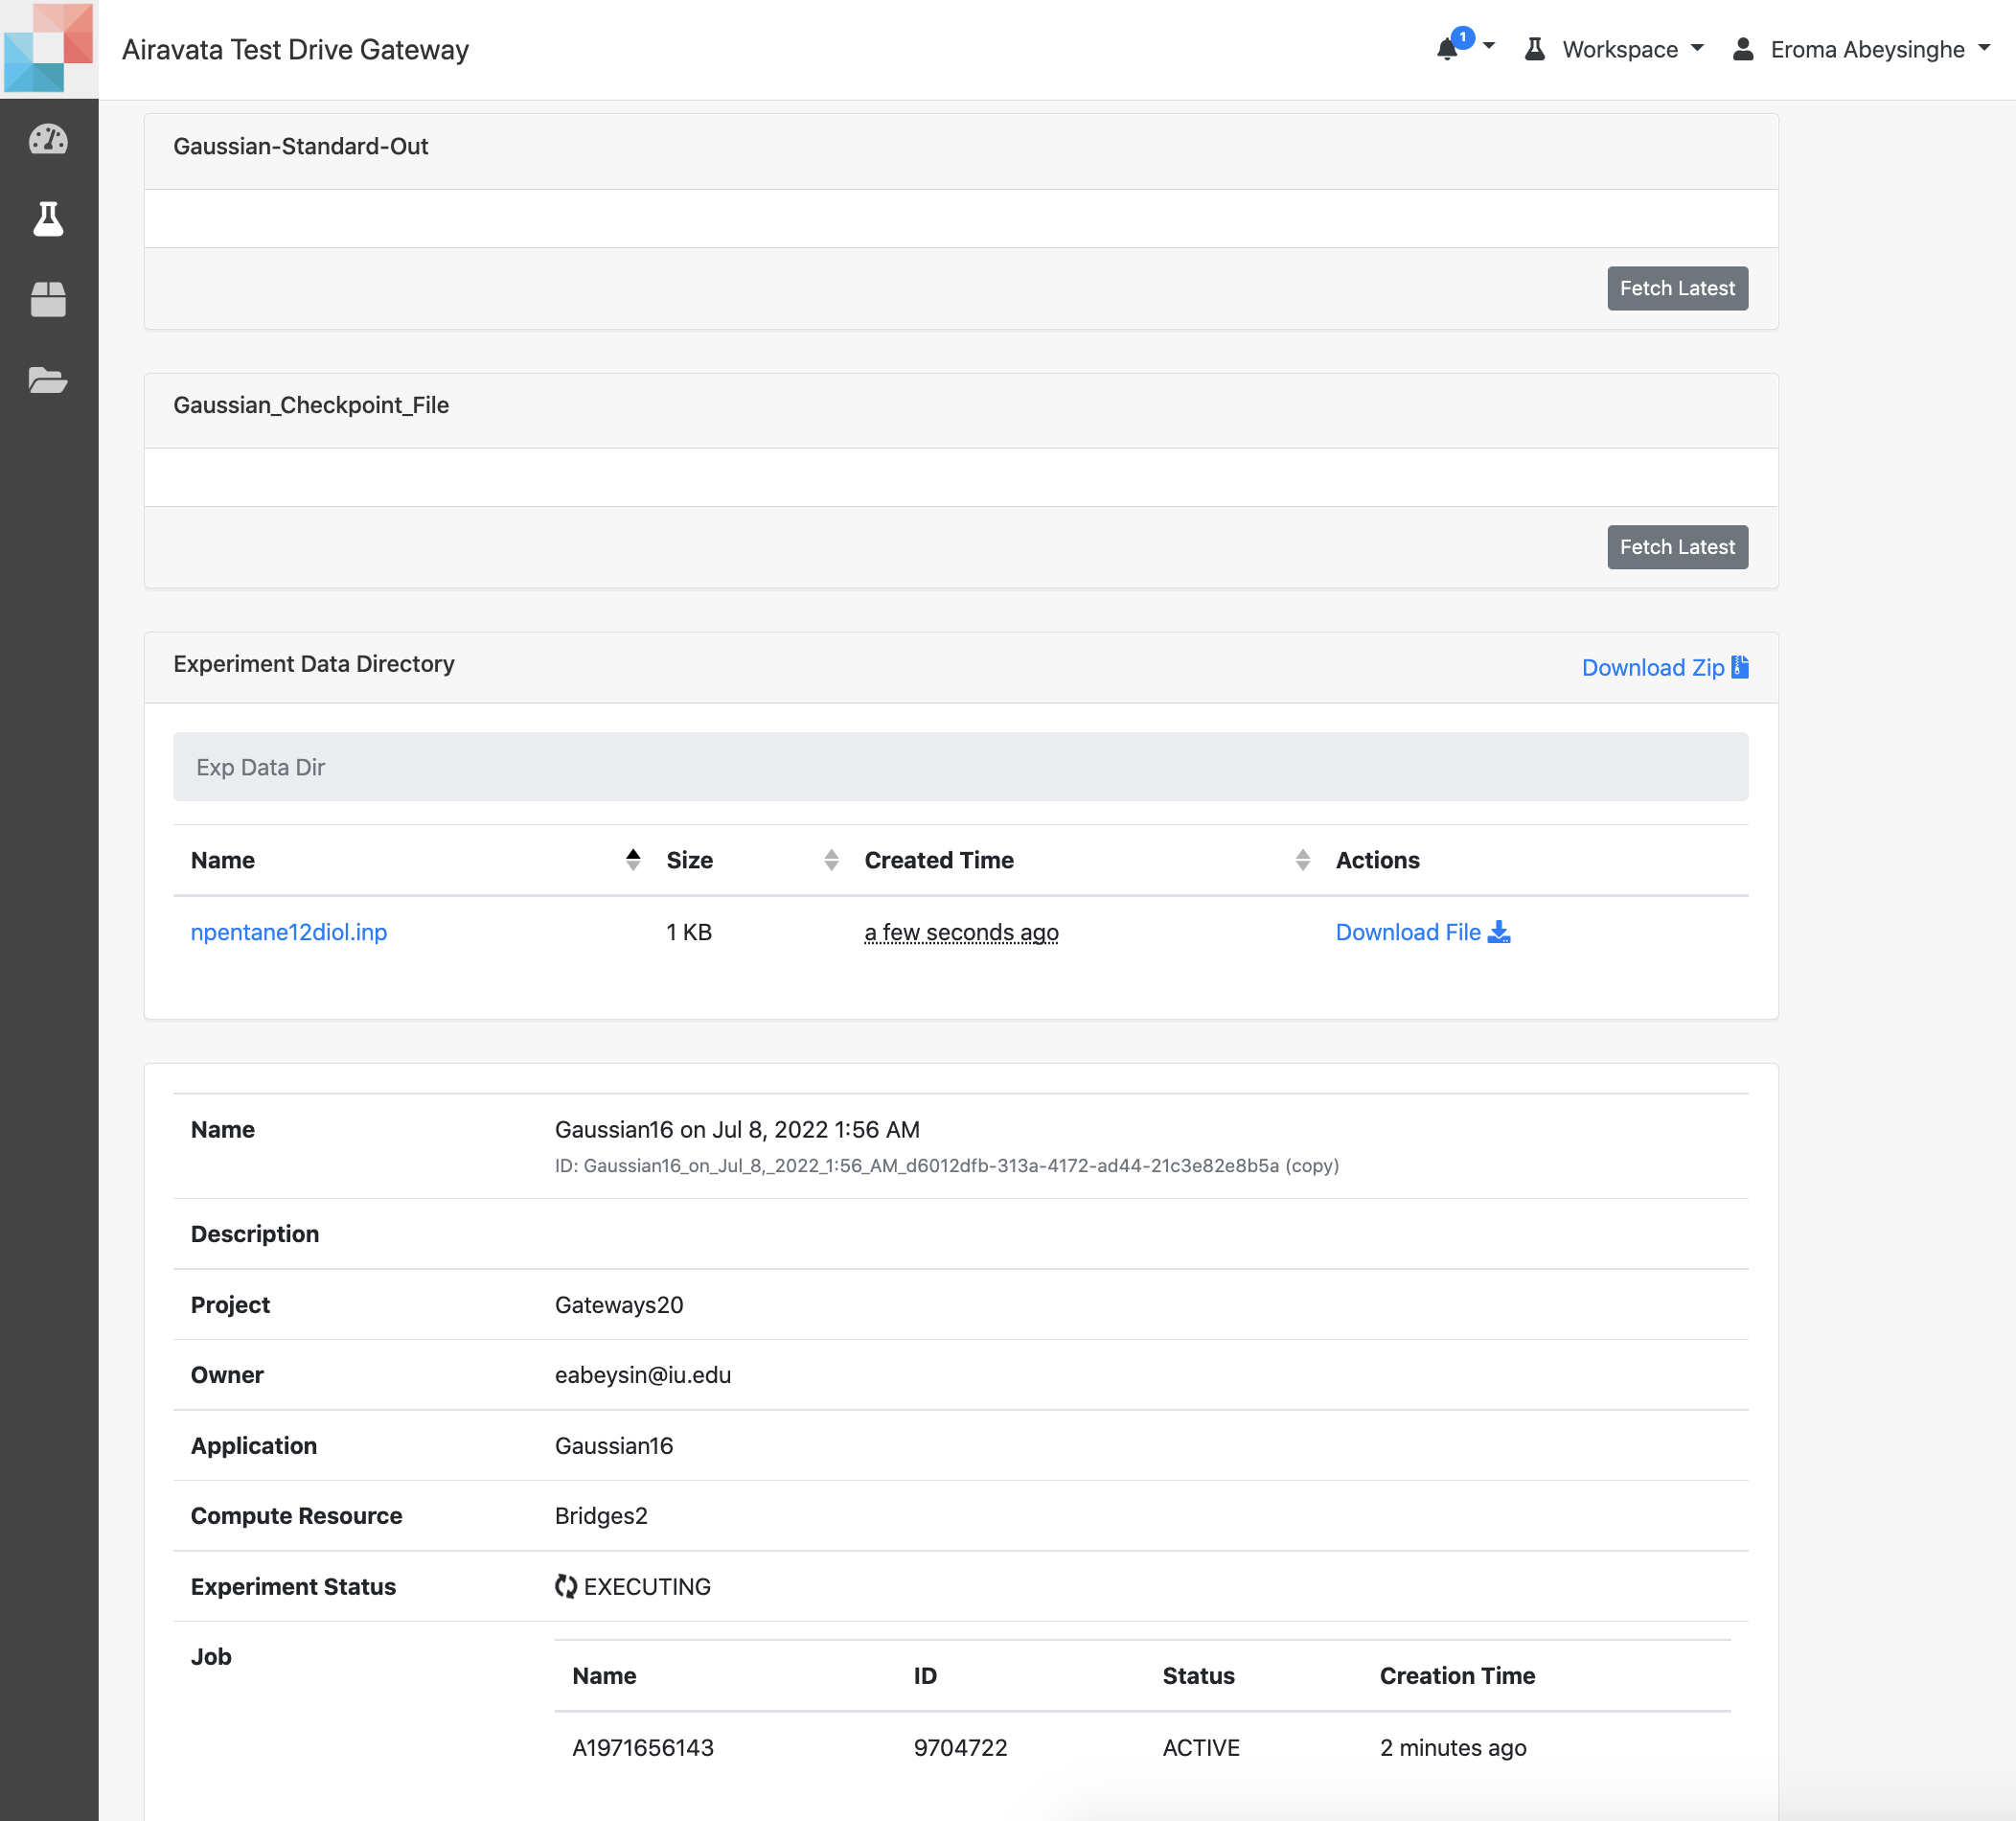 Image: Fetching Intermediate Files